Overview
Figure 1
summarises comparative measurements of three …A1 Detectors in a Photoconductive setup at Toptica Photonics AG (Germany). These three detectors are selected with maximum difference from each other. That means, the performance of detectors delivered to the customer may vary within these frames. Since measurements have been done in laboratory environment, water lines are clearly seen on the spectrum at several point frequencies starting with about 550 GHz and up to about 1400 GHz. This indicates that the measurements are performed correct and the detector signal indeed corresponds to the indicated frequency and are not just an artefact due to misinterpretation of the measurement results. After about 1.5 THz the signal is probably lost because at higher frequencies the THz signal from the used photoconductive setup becomes very small and below the noise floor of the detector. In fact, the noise floor of this detector is about 10 – 15 dB below 0.01 nA, and water lines should be seen up to about 2 THz. However, quasioptical measurements at such high frequencies are very tricky. Therefore, a good measurement setup and skilled operators are required to accurately perform such measurements. Measurement in another setup has demonstrated responsivity up to 1.7 THz and that was limited by available THz power at higher frequencies.
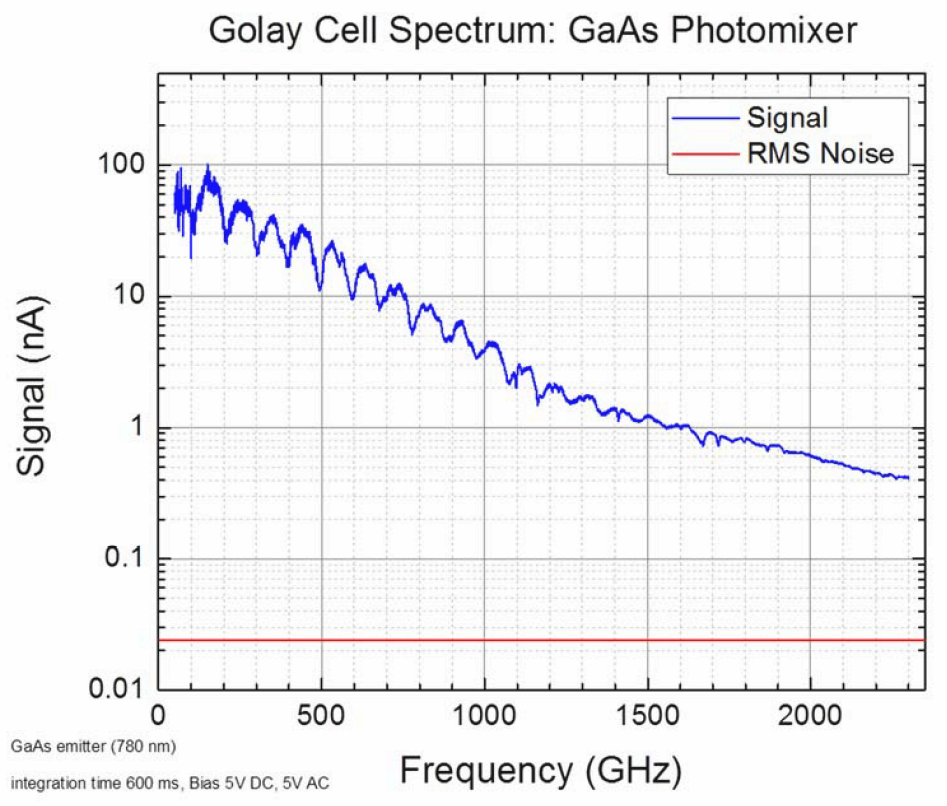
Figure 2
shows measurement results of the GaAs photoconductive setup used in Figure 1, but using a Golay Cell detector. The Golay Cell detector is assumed to have a frequency-independent response up to several THz but is very slow and not suitable for many applications. In fact, the ACST QOD were developed to replace the Golay Cell for applications, where fast response is required. Nevertheless, the results from Figure 2 can be compared to the results from Figure 1 to roughly estimate responsivity of 3DL 12C LS2500 A1 detector. If we compare the signal level at 100 GHz and at 1 THz in Figure 2, we estimate the drop of the TX signal level by factor of about 15. Same comparison from Figure 1 suggest the drop of the output signal by factor of 30 – 35. This suggests, that the responsivity and S/N of ACST QOD drops from 100 GHz to 1 THz by less than 20 dB! This is excellent performance for Schottky-based detectors!
Figure 1

Figure 2